US stocks rose for three days in a row, as investors parsed economic data that hinted at slower growth, which also prompted some to brush off the hawkish stance reiterated by Fed in June meeting minutes. All eyes need to be on the Fed, officials ‘’agreed” last month that interest rates may need to keep rising for longer to against entrenching inflation.
However, data released Wednesday showed that US job openings dipped slightly in May but remained near a record, and the growth in the US services sector also eased in June to a two-year low. This prompted some traders convinced that Fed’s stance has a little too real market situation.
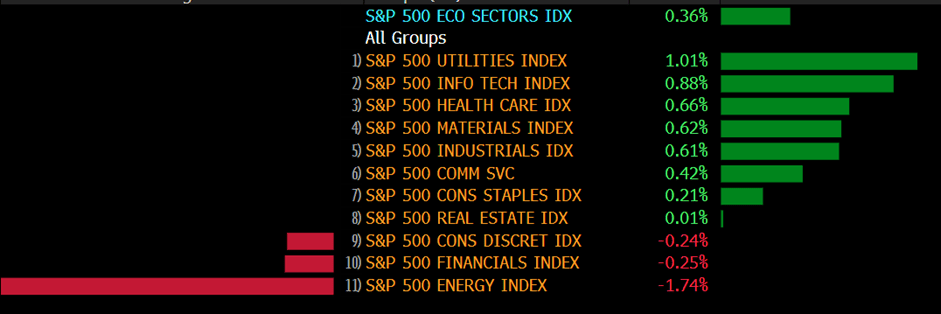
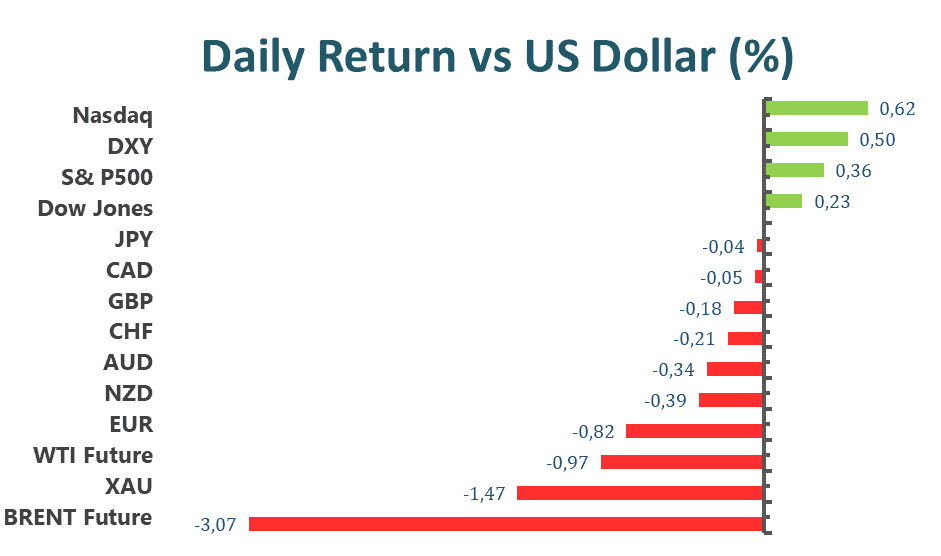
On the benchmark side, both S&P500 and Nasdaq 100 rose on Wednesday although Fed reiterated the hawkish stance in June meeting minutes. S&P500 was up 0.36% daily and the Nasdaq 100 also advanced with a 0.6% gain for the day. In addition, eight of eleven sectors stayed in positive territory as utilities and info tech sectors are the best among all groups, gaining 1.01% and 0.88%, respectively. It is worth noting that, the energy sector remains bad performance on Wednesday and lose 1.74%. The Dow Jones Industrial Average meanwhile increased by 0.2% and the MSCI world index declined by 0.5% on Wednesday.
Main Pairs Movement
The US dollar continued to rise for three straight days, and the DXY index surged up and cling to a 20-year high of 107.05 after the hawkish stance reiterated by Fed. This is a sign of the market still fears the global recession.
The EUR/USD remained bearish, the pair fell to a new 20-year low of 1.0161 at the last hour of Wednesday. Besides the Fed’s hawkish attitude toward US high inflation, the broad pessimism surrounding economic growth, central bankers’ aggregation, and the energy crisis make a downside pressure.
The GBP/USD was also in a bearish momentum despite a bounce-off on late Wednesday from a two-year low around 1.1925. The Cable pairs are still suffering from UK’s political joined Brexit woes and broad recession fears. However, the market anxiety ahead of the Fed’s stance and softer US economic data seems to have probed the bears of late.
Gold has turned into a consolidation phase after a sheer downside move to $1,732 in the NY session. As Fed’s aggressive attitude infused fresh blood into the US dollar, the precious metal suffered a high downside pressure.
Technical Analysis
USDJPY (4-Hour Chart)
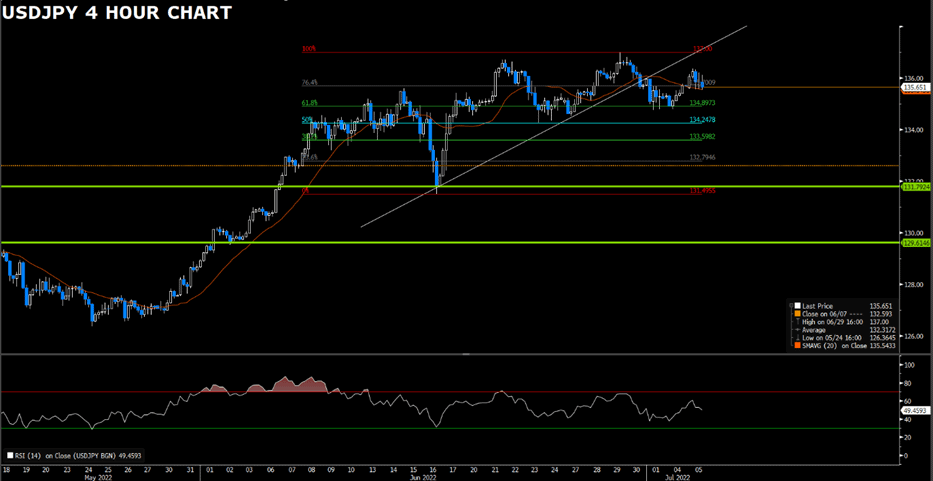
USDJPY edges slightly lower but keeps above the 135.00 level ahead of the FOMC meeting. From the technical perspective, the outlook maintains its bullish trend on the four-hour chart as the pair continues to trade within the ascending line. On the downside, falling below the support of 134.89 would bring the pair to the downside in the near- term. On the upside, the divergent monetary policies between the Fed and the BOJ would capitalize on the USD’s gain and undermine the Japanese Yen. As the RSI remains on the midline, further price action is eye on the FOMC meeting.
Resistance: 135.7, 137
Support: 134.89, 134.24, 133.59
GBPUSD (4-Hour Chart)
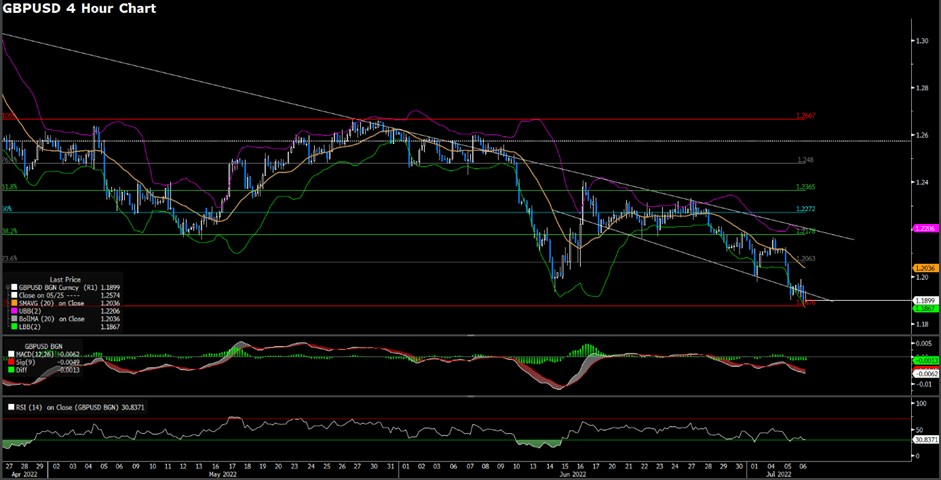
GBPUSD holds above the support level of 1.1876 at the time of writing ahead of the FOMC meeting. The US dollar remains strong and outperforms the British Pound on the back of better-than-expected ISM Service PMI economic data. From the technical aspect, the outlook of GBPUSD remains bearish on the four-hour chart as the pair falls within and below the descending channel, suggesting that GBP is lack attraction. In the meantime, a bearish MACD continues to lend support to bears while the RSI is on the edge of 30 readings. The pivot support of 1.1876 would be viewed as a defending cross-line, whether regaining the buyers’ confidence. If the support cannot sustain, then it is expected to see the currency pair extend further south.
Resistance: 1.2063, 1.2178, 1.2272
Support: 1.1876
Gold (4-Hour Chart)
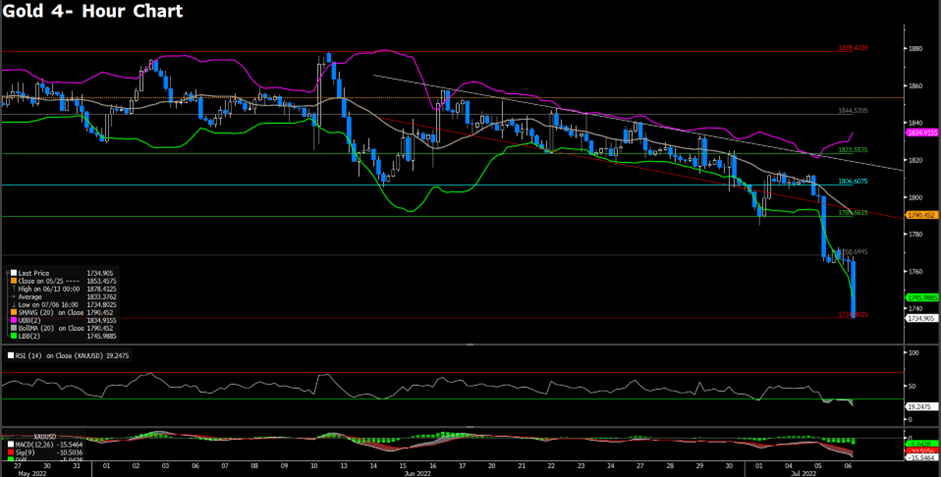
Gold extends its slump below $1740, a fresh 10- month low ahead of FOMC Minutes. The Dollar Index and the benchmark 10- year US Treasury yield continues to soar, putting additional weight on the precious metal, gold. From the technical perspective, the intraday outlook remains downside as the pivotal support from yesterday fails to defend, now attracting more follow-through sellers. In the meantime, a bearish MACD signal also hints at gold’s further downside toward the next support of $1736.20. However, an oversold RSI might give the selling pressures a break; some dip buyers might start buying at this stage before FOMC Minutes.
Resistance: 1768.69, 1789.66, 1806.60
Support: 1734.80
Economic Data
| Currency | Data | Time (GMT + 8) | Forecast |
| EUR | ECB President Lagarde Speaks | 19:55 | |
| USD | Nonfarm Payrolls (Jun) | 20:30 | 268K |
| USD | Unemployment Rate (Jun) | 20:30 | 3.6% |
| CAD | Employment Change (Jun) | 20:30 | 23.5K |

This site uses cookies to provide you with a great user experience.
By using asia.vtmarkets.com, you accept
our cookie policy.


![]()
Follow us on:


![]()