US stock notched a weekly gain on Friday, as a release of an unexpectedly strong jobs report, which alleviated recession fears but cleared the path for the Federal Reserve to raise interest rates in a more hawkish way at its next meeting. The report validated the Fed’s view of a resilient economy that can withstand additional interest rate hikes and also forced investors to recalibrate their expectations of the next interest rate policy, a 75 bps hike is the more likely scenario at the September meeting. Some investors have resumed shunning global stocks in favour of bonds while corporate earnings, combined with thin liquidity that is common in the summer, took the stock market on a ride this week, and many firms beat the forecast and proved they could handle high inflation and a gloomy economic outlook.
The benchmark, S&P500 slid with a 0.16% loss on a daily basis after falling as much as 1.1% during the trading session. Six out of eleven sectors stayed in negative territory, as Consumer Discretion and Communication Service performed worst among all groups, falling 1.66% and 0.88% respectively while the Energy sector rose with a 2.04% gain on Friday. However, the Dow Jones Industrial Average rose 0.2%, Nasdaq 100 dropped 0.8%, and the MSCI world index rose 0.3%.
Main Pairs Movement
The US dollar rallied on Friday after a surprisingly strong job on the US payrolls report suggested the Federal Reserve may take a more aggressive interest rate hike policy. The DXY index surged with a 0.84% gain on a daily basis, and climbed to a daily high level above 106.9 after a report showed nonfarm payrolls increased by 528k jobs last month, which is the largest gain since February.
The GBP/USD dropped with a 0.72% loss on a daily basis for the day, as an unexpected powerful NFP report led to advances in the greenback across the board, weighing heavily on its peers. It’s worth noting that, the Bank of England raised the rate by the most in 27 years to fight runaway inflation in a dovish 50bp hike to 1.75%, and said that a long recession was coming, highlighting the bleak outlook for the UK economy and the pound. Meanwhile, EUR/USD touched a daily low of nearly 1.014 level, and the pairs declined with a 0.61% loss on Friday.
The Gold fell with a 0.88% loss on a daily basis, as the US dollar is strong across the board, and XAUUSD touched a daily low of $1765 marks during the US training session. The investors need to keep their eyes out for the consumer and producer index next week.
Technical Analysis
EURUSD (4-Hour Chart)

The EUR/USD pair tumbled on Friday, witnessing heavy selling and dropped to a daily low below the 1.015 mark after the release of US Nonfarm Payrolls for July. The pair is now trading at 1.01580, posting a 0.86% loss on a daily basis. EUR/USD stays in the negative territory amid renewed strength observed in the US dollar, as the upbeat US jobs report provided a strong boost to the safe-haven greenback and undermined the EUR/USD pair. The US Nonfarm Payrolls rise by 528K in July, which came in better than the expectations of 250K and showed the growth momentum in the US jobs market. On top of that, the higher-than-expected NFP results also reignited the perception of a more aggressive policy tightening by the Fed in the next months. For the Euro, the increasing speculation of a potential recession in the Eurozone continued to exert bearish pressure on the shared currency.
For the technical aspect, the RSI indicator is 42 figures as of writing, suggesting that the downside is more favoured as the RSI stays below the mid-line. As for the Bollinger Bands, the price witnessed fresh selling and crossed below the moving average, therefore the bearish momentum should persist. In conclusion, we think the market will be bearish as the pair is heading to test the 1.0150 support line. A break below that level could lead the pair toward the 1.011 mark.
Resistance: 1.0289, 1.0438, 1.0486
Support: 1.0150, 1.0111, 0.9991
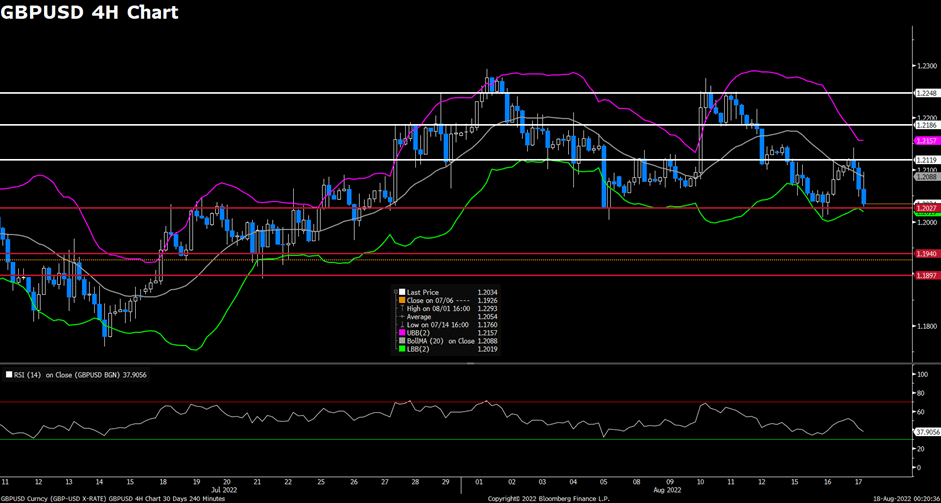
GBPUSD (4-Hour Chart)

The GBP/USD pair slipped on Friday, extending its previous slide and dropping sharply to a two-week low below the 1.202 level amid a stronger US dollar across the board. At the time of writing, the cable stays in negative territory with a 0.83% loss for the day. The upbeat US Nonfarm Payrolls that was released earlier in the European session has revived bets for a larger interest rate hike at the September FOMC policy meeting. There is now a 70% probability of a 75 basis points hike at the next policy meeting amid more hawkish comments by several Fed officials this week. For the British pound, the gloomy outlook for the UK economy and the comments from the BoE that a long recession is coming in the fourth quarter of this year both acted as a headwind for the cable.
For the technical aspect, the RSI indicator is 37 figures as of writing, suggesting that the pair is facing bearish pressure but the RSI has rebounded toward the mid-line. For the Bollinger Bands, the price rebounded after falling out of the lower band, therefore some upside traction can be expected. In conclusion, we think the market will be slightly bullish as long as the 1.2007 support line holds. The rising RSI also reflects bull signals. On the downside, sellers could take action if 1.2007 support fails.
Resistance: 1.2178, 1.2277, 1.2317
Support: 1.2007, 1.1933, 1.1830
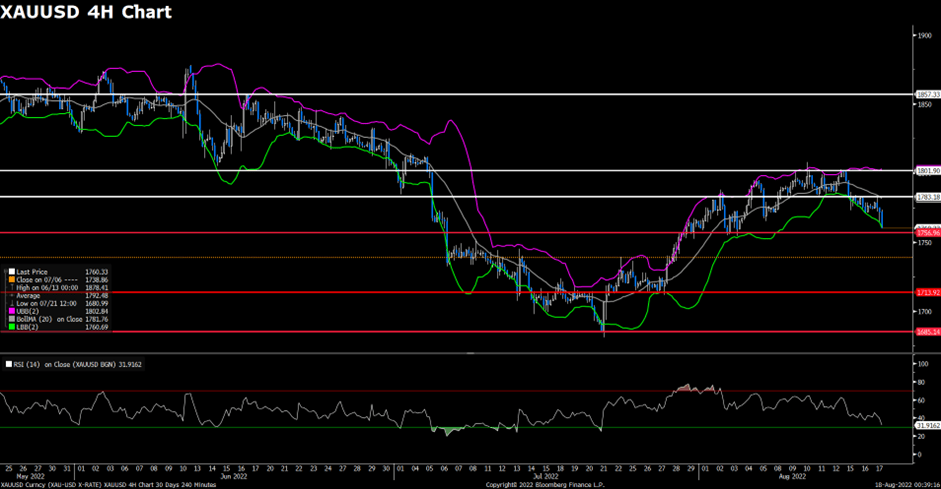
XAUUSD (4-Hour Chart)

As the US dollar continued to find demand amid the stronger-than-expected US employment report on Friday, the pair XAU/USD came under heavy selling pressure and slumped to a daily low below the $1,767 level at the start of the US trading session. XAU/USD is trading at 1777.82 at the time of writing, losing 0.73% on a daily basis. The renewed strength witnessed in the US dollar continued to undermine the dollar-denominated gold, as investors have lifted their bets for a larger Fed rate hike move at the September meeting. However, the growing fears of recession and China-Taiwan tensions should limit the downside for the precious metal after the news showed that China conducted missile strikes in the Taiwan Strait.
For the technical aspect, the RSI indicator is 50 figures as of writing, suggesting the pair’s indecisiveness in the near term as the RSI indicator stays near. For the Bollinger Bands, the price regained some upside traction and rose toward the moving average, therefore a continuation of the upside trend could be expected. In conclusion, we think the market will be slightly bullish as long as the 1771.12 support line holds. A break below that level might favour the bear and open the door for additional losses.
Resistance: 1785, 1794, 1811
Support: 1771, 1756, 1738

This site uses cookies to provide you with a great user experience.
By using asia.vtmarkets.com, you accept
our cookie policy.


![]()
Follow us on:


![]()