Lead by big tech, US stock advanced on Friday and notched the best month since 2020. Amazon.com Inc. and Apple Inc. soared as higher revenues from the pair’s iconic powerhouses relieved fears of profit slowdown on profit growth. Despite some concerning indications from economic indicators, the earnings season as a whole has outperformed expectations, with over 75% of S&P500 corporations reporting results that exceeded analyst expectations. Investors cannot resist but predict that Corporate America will be able to weather the storm of inflation, massive rate hikes, and slowing economic growth.
However, two key US price indexes reported higher than forecast, especially the personal consumption expenditures index, which Federal Reserve highly focused on, climbing at the fastest pace since 2005. Overall, the rebound of stocks this month has not yet convinced investors that a new bull market has begun.
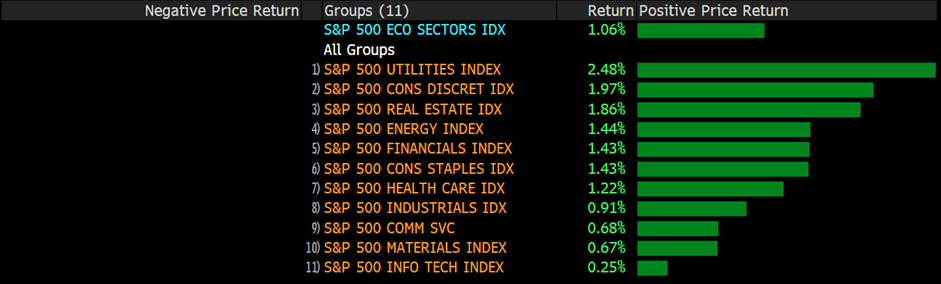
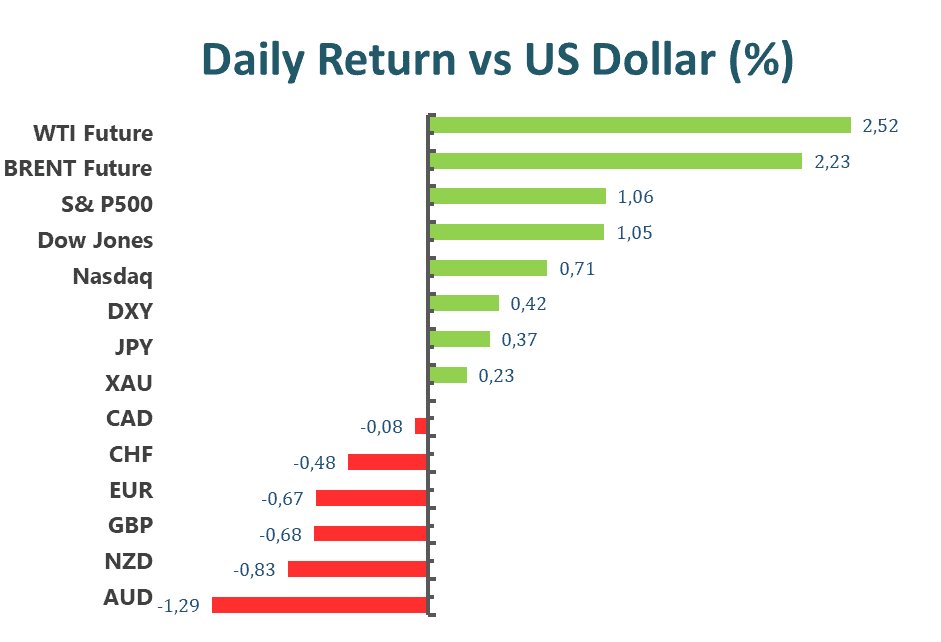
Due to a stronger-than-expected earnings season, the S&P500 and the Dow Jones Industrial Average rose on Friday. The S&P500 increased 1.42% daily, while the Dow Jones Industrial Average rose 1% daily. Energy and Consumers Discretion have the best performance of all sectors, increasing by 4.51% and 4.27%, respectively. Meanwhile, the Nasdaq 100 increased by 1.8% on Friday, while the MSCI World index increased by 1.2%.
Main Pairs Movement
On Friday, the US dollar fell to a three-week low below 105.6 as speculation swirled over a possible recession in the wake of conflicting economic data. The DXY index maintained its bearish trend and dropped to a three-week low during the first half of the trading day, before rebounding to a daily high over 106.6 during the middle of the European trading session. Inflation in the United States remained inexorable in June, according to the US price index, and an increase in interest rates is not inconceivable.
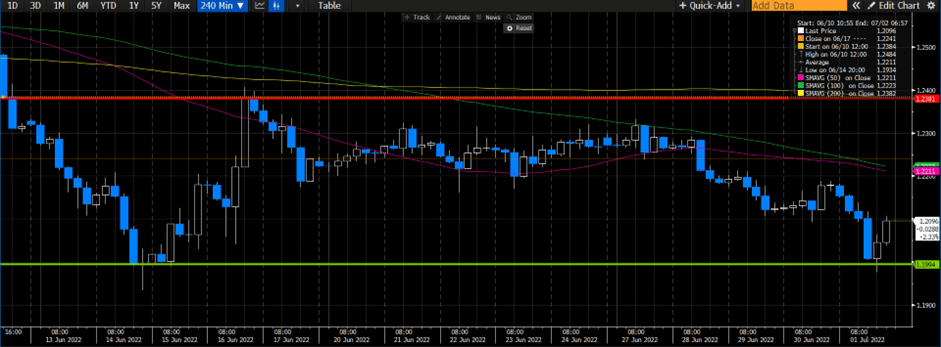
The GBPUSD was steady on Friday, losing 0.07%. The cables witnessed some new transactions and reached a daily high level above 1.224 during the Asia trading session amid a weak US dollar across the board. However, the cables fell to a daily low level below 1.207 following the release of a strong US Personal Consumption Expenditures report ahead of the New York trading session. During the middle of the Asia session, EURUSD reached a daily high above 1.025 before falling to a low below 1.015. The pair increased by 0.23% on the day.
Gold climbed 0.58% daily and is now firmly established at over $1760 as US yields erase prior gains and inflation fears. In the meantime, WTI crude oil gained bullish momentum throughout the late Asian session and surpassed $99 per barrel on Friday.
Technical Analysis
XAUUSD(4-Hour Chart)
Gold gathers bullish move following a dip earlier in the session as the US yields turn south. From the technical perspective, gold continues to build its upside momentum beyond the 1746 support zone and gains positive traction for the third consecutive day on Friday at the time of writing. The four-hour outlook is bullish as gold remains way above the ascending trend line. Despite the RSI indicator having reached beyond the overbought territory, the positive MACD seems to continue to support the bulls. As long as gold sustains its momentum above the trend line, its positive outlook remains unchanged. To the upside, the breakout of the immediate hurdle of 1766 would give gold another rally.
Resistance: 1766, 1786, 1811
Support: 1746, 1721, 1680
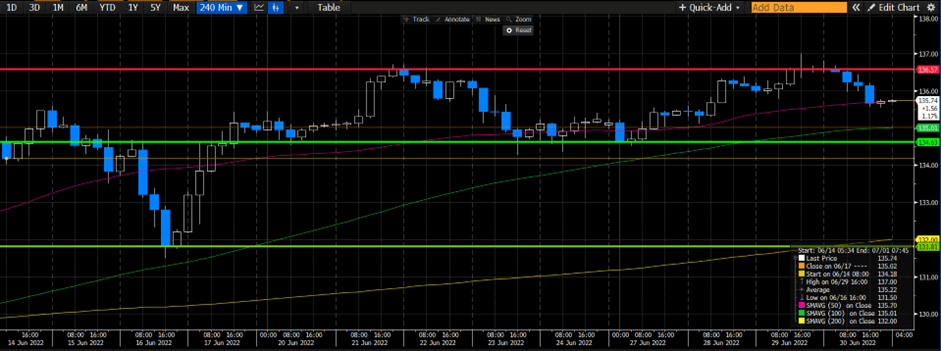
USDJPY (4-Hour Chart)
USDJPY plunges badly to near 133.00 as the US dollar confronts selling pressure following the fading aggressive Fed tightening expectations. From the technical perspective, it is now seen as in correction to the four-hour outlook up trend. Since USDJPY has officially broken the bullish channel, the bias becomes a downside. Strong support is expected to see at 132.50 for the rebound. A breakout of the support level of 132.50 would accelerate the downside, heading further south. For now, for the bull to reclaim its position, USDJPY needs to at least rise above 135.94.
Resistance: 134.13, 135.13, 135.94
Support: 132.50
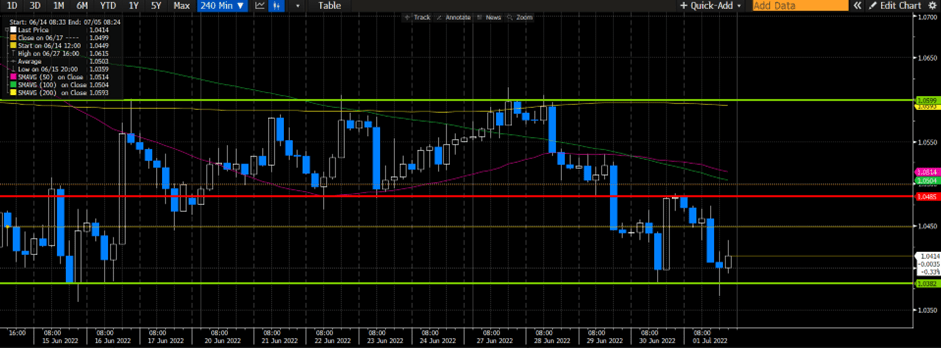
EURUSD (4-Hour Chart)
EURUSD edges higher near 1.0200 as the US dollar loses traction. From the technical aspect, the euro dollar starts a fresh recovery against the dollar after hitting the midline of the Bollinger band and the 20 Simple Moving Average. EURUSD looks to oscillate in the range of 1.0109- 1.0284 on the four-hour chart. The outlook of EURUSD is currently neutral as the RSI indicator hovers around the midline and the MACD remains neutral. On the upside, the resistance of 1.0284 would be the first major hurdle to break to begin the bullish move of the euro dollar. On the contrary, if EURUSD falls below 1.0109, the pair might decline towards the 0.9952 level.
Resistance: 1.0284, 1.0362, 1.0459
Support: 1.0109, 0.9952
Economic Data
| Currency | Data | Time (GMT + 8) | Forecast |
| CNY | Caixin Manufacturing PMI (Jul) | 09:45 | 51.5 |
| EUR | German Manufacturing PMI (Jul) | 15:55 | 49.2 |
| GBP | Manufacturing PMI (Jul) | 16:30 | 52.2 |
| USD | ISM Manufacturing PMI (Jul) | 22:00 | 52.0 |

This site uses cookies to provide you with a great user experience.
By using asia.vtmarkets.com, you accept
our cookie policy.


![]()
Follow us on:


![]()